A LiDAR flight of a line corridor generates millions of points, but the raw data prevents not a single incident. What prevents outages and fires is knowing, precisely, where vegetation gets too close to the conductor and what to do first. Let's see how Neobora turns that flight into an actionable pruning plan.
The problem: vegetation and the right-of-way
Vegetation encroaching on the right-of-way is one of the main causes of incidents on transmission and distribution grids: supply cuts, protection trips and, in the worst case, fire risk. Keeping the safety distance between conductors and trees is a recurring, costly obligation, and doing it by walking the line or with scattered photos is slow, subjective and hard to prioritize across hundreds of kilometres.
Why LiDAR is the foundation
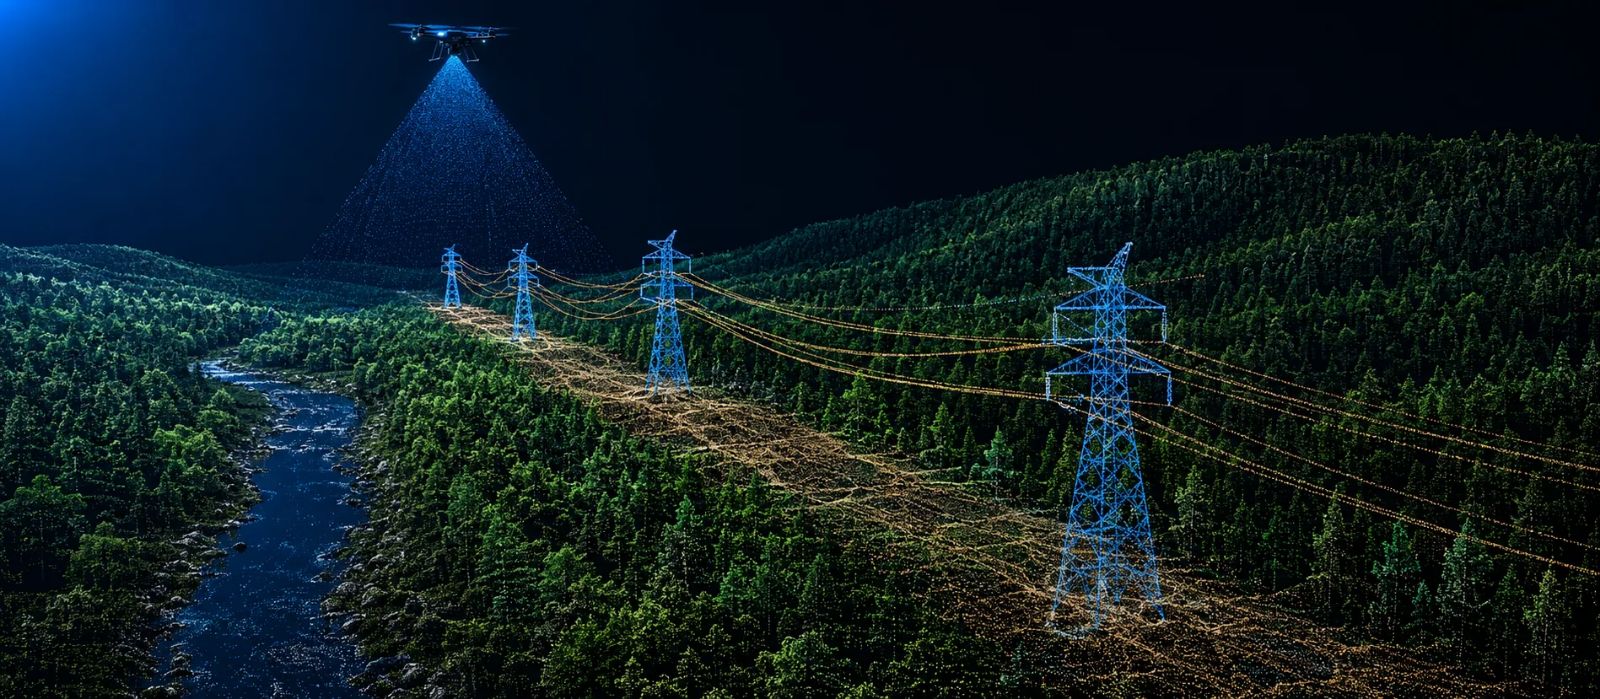
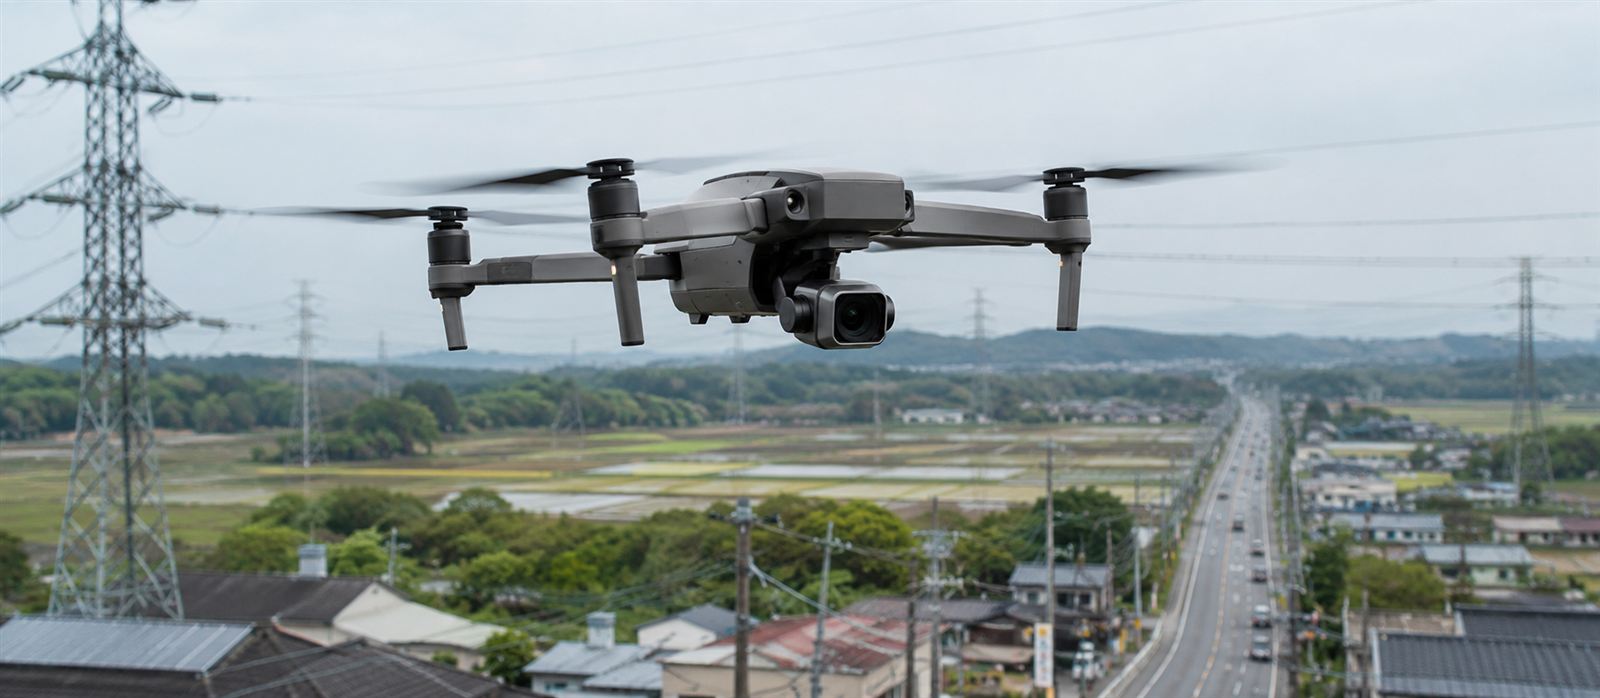
A photographic inspection tells you that there is vegetation nearby; LiDAR tells you how much. A flight with drone, helicopter or plane captures the entire corridor in 3D —terrain, conductors, towers and vegetation— with centimetre accuracy. It is the only way to measure real distances in space, not to estimate them from a 2D image.
Classifying the corridor with AI
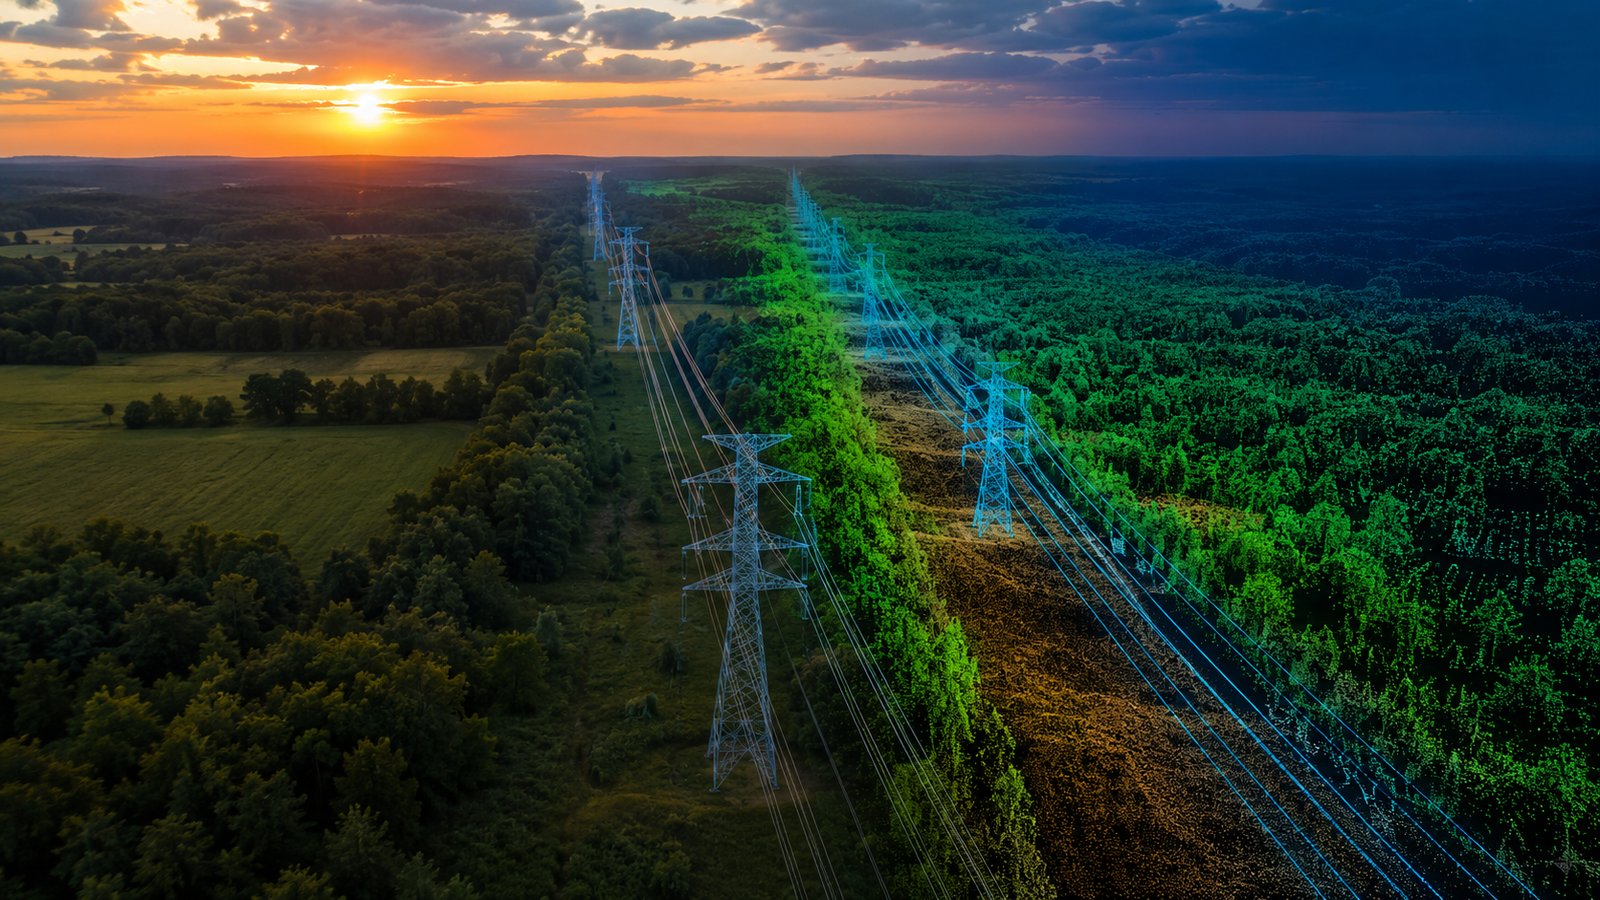
This is where Neobora comes in. You upload the flight —even terabytes— with the Transfer Manager, which parallelizes the upload and resumes it automatically if the connection drops, and Neobora's LiDAR classification AI separates ground, vegetation, conductors and towers in the cloud at a scale of millions of points per minute. The operator no longer labels by hand: with the editor and quality-control tools built into the same platform, they only review and fix what the model flags as uncertain, without exporting to another tool.
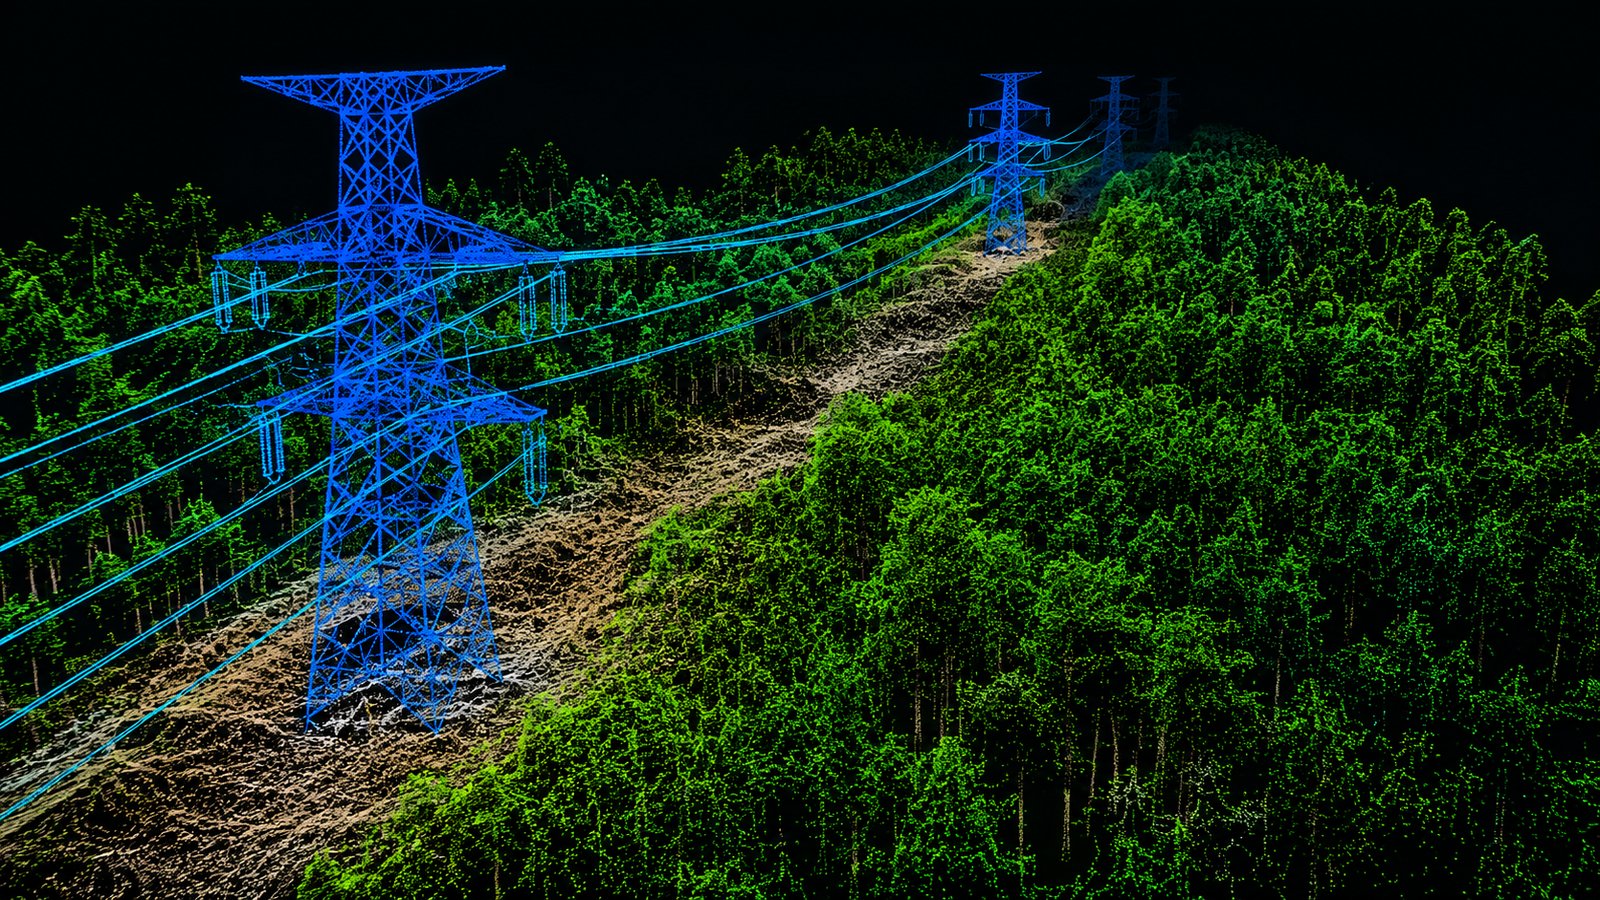
The value is not in the point cloud, but in the prioritized list of what to prune first — and that is where Neobora turns data into decisions.
Conductor-to-vegetation clearance
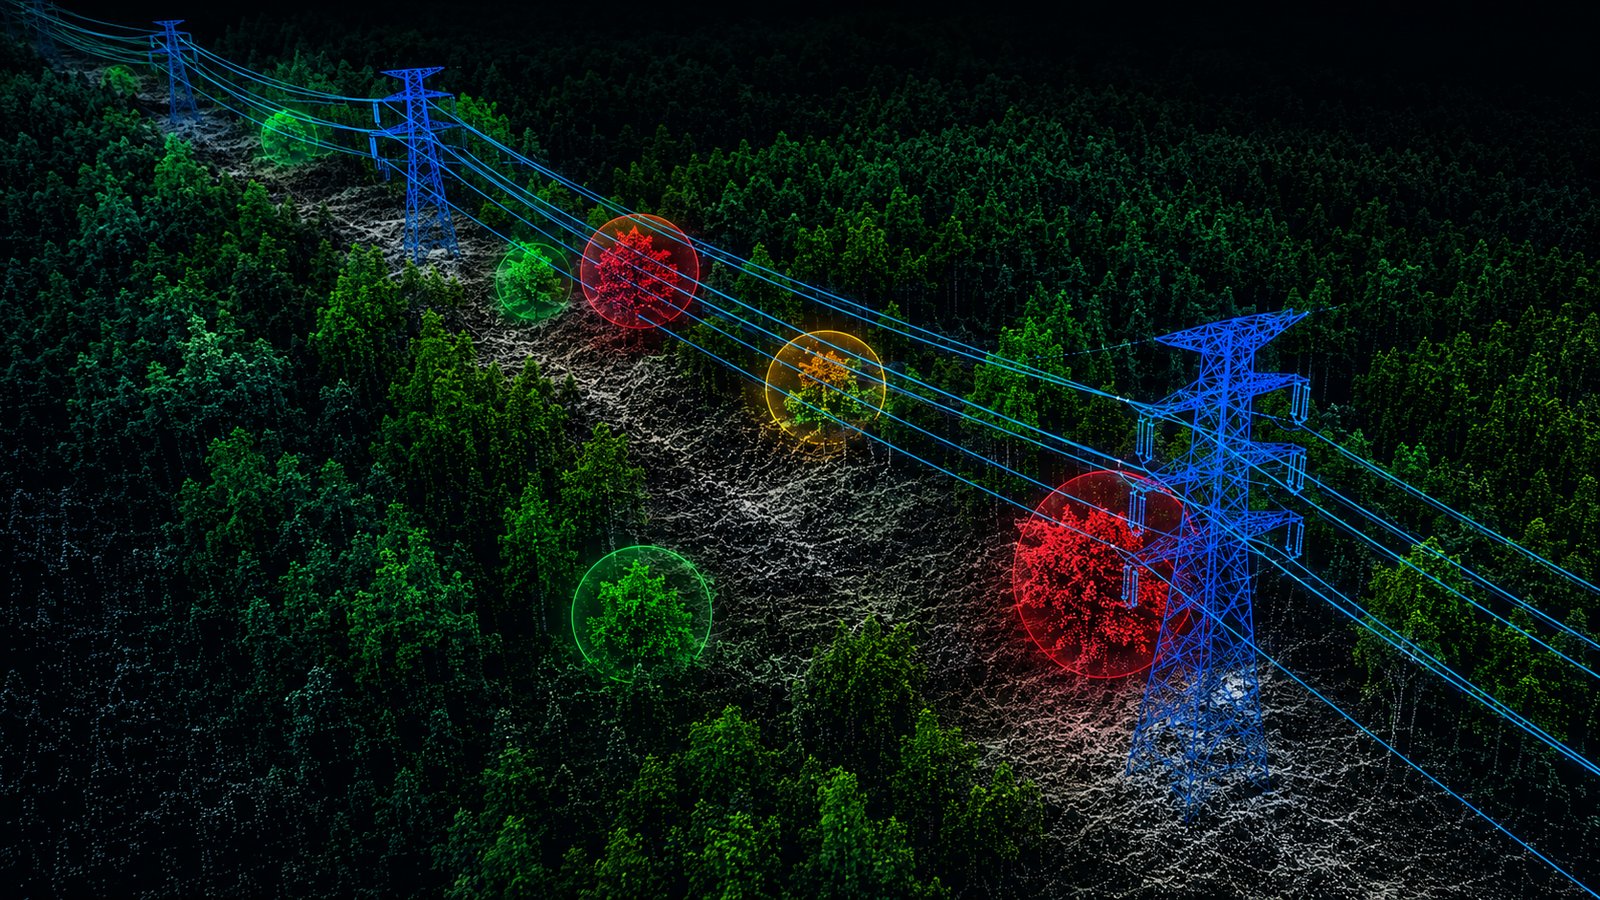
With the corridor classified, Neobora's algorithm manager runs the 3D distance calculation in the cloud between each conductor and the vegetation —and also to the ground and structures— and generates a clearance report that flags every point below the safety threshold, with its exact value and location. It is not a fuzzy heat map: they are concrete, measurable, located incidents.
The worst case: the catenary
A conductor is not still: it sags with temperature and load, and moves with the wind. Measuring the distance only in the position on the day of the flight falls short. That is why Neobora includes conductor-sag (catenary) simulation: it models the conductor under unfavourable conditions (maximum sag) and checks the distance against that scenario, not just against the instantaneous snapshot. This way you detect encroachments that aren't there today, but will be on the day of highest demand.
From data to pruning plan
Hundreds of unordered incidents help no one. Neobora turns them into a prioritized output —which spans and towers to act on first, with what severity and what volume of vegetation— that crews consume directly. A technical report becomes a work plan with judgement and traceability.
Growth and prediction
Because Neobora keeps the history and lets you explore how the grid and its assets evolve over time, comparing successive flights of the same corridor reveals the vegetation growth rate per section. You stop reacting and start planning the next pruning before it trips an alarm.
Delivery: geoportal and reports
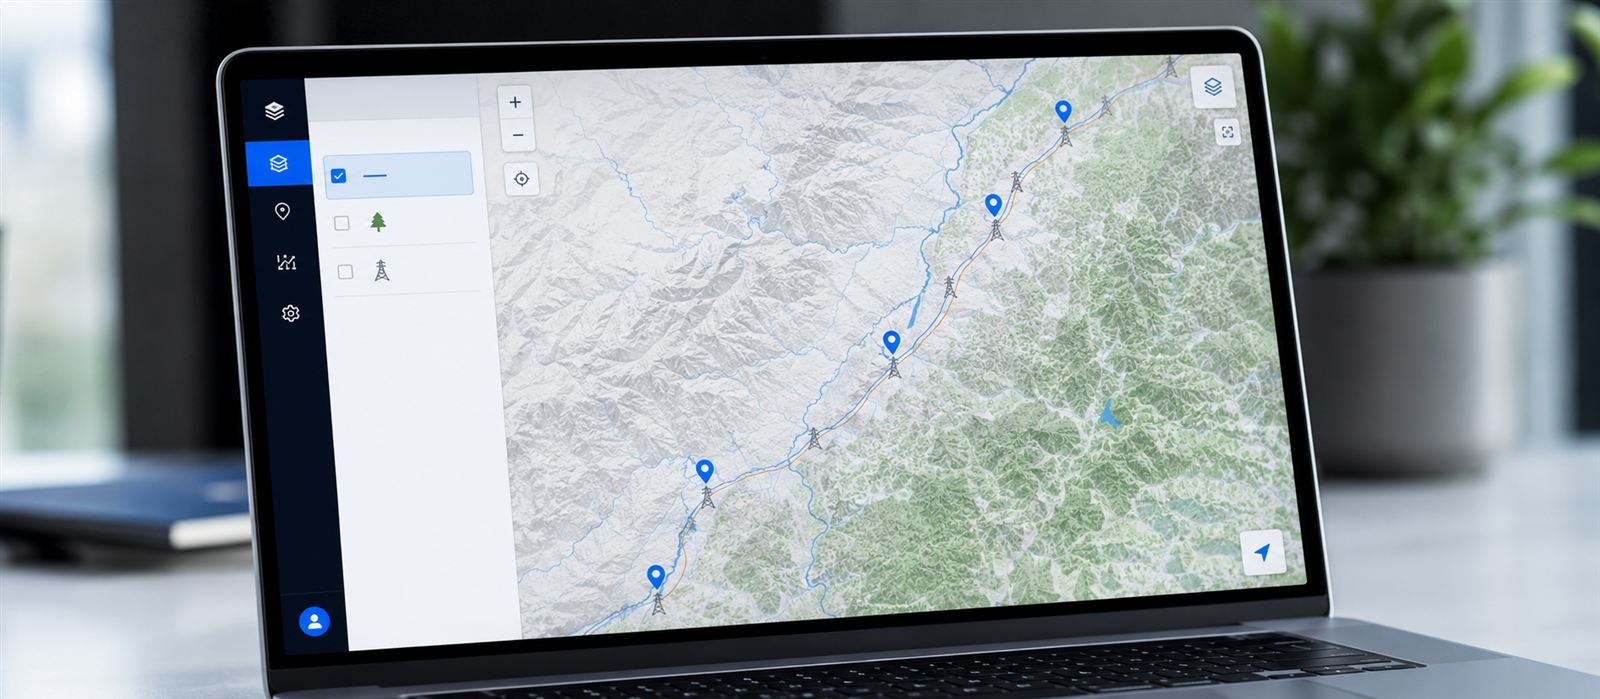
Everything lives in a Neobora geoportal: crews see the incidents on the map, with their own views and permissions, from the browser or the desktop app; and the clearance reports come out ready for operations. Since it is critical infrastructure, the data stays under your control —in the cloud or on-premise if you need it— with a pay-per-use model that adapts to campaign peaks.
Conclusion
LiDAR with AI does not replace the grid manager's judgement: it gives them an objective, prioritized basis to decide where and when to prune, with fewer field visits and fewer surprises. Neobora chains the whole workflow in a single platform —from uploading the flight to the pruning plan— without jumping between tools. From point cloud to decision, in one place.